編輯:關於Android編程
繪制曲線類:

public class BaseFundChartView extends View {

    Paint linePaint;
    Paint textPaint;
    Paint xyChartPaint;
    Paint chartLinePaint;
    Paint chartJianbianPaint;
    List points;
    public BaseFundChartView(Context context, AttributeSet attrs, int defStyleAttr) {
        super(context, attrs, defStyleAttr);
        init();
    }

    public BaseFundChartView(Context context) {
        this(context, null);
    }

    public BaseFundChartView(Context context, AttributeSet attrs) {
        this(context, attrs, 0);
    }

    PathEffect effect;
    Path path;

    private void init() {
        linePaint = new Paint();
        textPaint = new Paint();
        xyChartPaint = new Paint();
        chartLinePaint = new Paint();
        chartJianbianPaint = new Paint();

        //設置繪制模式為-虛線作為背景線。
        effect = new DashPathEffect(new float[] { 6, 6, 6, 6, 6}, 2);
        //背景虛線路徑.
        path = new Path();
        //只是繪制的XY軸
        linePaint.setStyle(Paint.Style.STROKE);
//        linePaint.setStrokeWidth((float) 0.7);
        linePaint.setStrokeWidth((float) 1.0);             //設置線寬

        linePaint.setColor(Color.BLACK);
        linePaint.setAntiAlias(true);// 鋸齒不顯示

        //XY刻度上的字
        textPaint.setStyle(Paint.Style.FILL);// 設置非填充
        textPaint.setStrokeWidth(1);// 筆寬5像素
        textPaint.setColor(Color.BLACK);// 設置為藍筆
        textPaint.setAntiAlias(true);// 鋸齒不顯示
        textPaint.setTextAlign(Paint.Align.CENTER);
        textPaint.setTextSize(15);

        //繪制XY軸上的字:Y開關狀態、X時間
        xyChartPaint.setStyle(Paint.Style.FILL);
        xyChartPaint.setStrokeWidth(1);
        xyChartPaint.setColor(Color.BLUE);
        xyChartPaint.setAntiAlias(true);
        xyChartPaint.setTextAlign(Paint.Align.CENTER);
        xyChartPaint.setTextSize(18);
        //繪制的折線
        chartLinePaint.setStyle(Paint.Style.STROKE);
        chartLinePaint.setStrokeWidth(5);
        chartLinePaint.setColor(Color.BLUE);
        chartLinePaint.setAntiAlias(true);

        //繪制的折線
        chartJianbianPaint.setStyle(Paint.Style.FILL);
        chartJianbianPaint.setStrokeWidth(5);
        //chartJianbianPaint.setColor(Color.YELLOW);

        chartJianbianPaint.setAntiAlias(true);

    }

    /**
     * 重要參數,兩點之間分為幾段描畫,數字愈大分段越多,描畫的曲線就越精細.
     */
    private static final int STEPS = 12;

    float gridX,gridY,xSpace = 0,ySpace = 0,spaceYT = 0,yStart=0;
    List dateX = null;
    List dateY = null;

    List> data = null;

    List colors = null;

    public void setColors(List colors) {
        this.colors = colors;
    }

    public List getDateY() {
        return dateY;
    }

    public void setDateY(List dateY) {
        this.dateY = dateY;
    }

    public List> getData() {
        return data;
    }

    public void setData(List> data) {
        this.data = data;
    }

    public List getDateX() {
        return dateX;
    }

    public void setDateX(List dateX) {
        this.dateX = dateX;
    }

    @Override
    protected void onDraw(Canvas canvas) {
        super.onDraw(canvas);

        //基准點。
        gridX = 40;
        gridY = getHeight() - 50;
        //XY間隔。
        if(dateX!=null&&dateX.size()>0){
            xSpace = (getWidth() - gridX)/dateX.size();
        }

        if(dateY!=null&&dateY.size()>0){
            ySpace = (gridY - 70)/dateY.size();
            yStart = dateY.get(0);
            if(dateY.size()>2){
                spaceYT = Math.abs(dateY.get(1)-dateY.get(0));
            }
        }

        UIUtils.log("rewqfdesa",gridY,"fdsafdsa");

        //畫Y軸(帶箭頭)。
        canvas.drawLine(gridX, gridY - 20 - 10, gridX, 30 + 10, linePaint);
        canvas.drawLine(gridX, 30 + 10, gridX - 6, 30 + 14 + 10, linePaint);//Y軸箭頭。
        canvas.drawLine(gridX, 30 + 10, gridX + 6, 30 + 14 + 10, linePaint);

        //畫Y軸名字。
        //由於是豎直顯示的,先以原點順時針旋轉90度後為新的坐標系
        //canvas.rotate(-90);
        //當xyChartPaint的setTextAlign()設置為center時第二、三個參數代表這四個字中點所在的xy坐標

        //canvas.drawText("開關狀態", -((float) (getHeight() - 60) - 15 - 5 - 1 / ((float) 1.6 * 1) * (getHeight() - 60) / 2), gridX - 15, xyChartPaint);
        //繪制Y軸坐標


        //canvas.rotate(90); //改變了坐標系還要再改過來
        float y = 0;
        //畫X軸。
        y = gridY - 20;
        canvas.drawLine(gridX, y - 10, getWidth(), y - 10, linePaint);//X軸.
        canvas.drawLine(getWidth(), y - 10, getWidth() - 14, y - 6 - 10, linePaint);//X軸箭頭。
        canvas.drawLine(getWidth(), y - 10, getWidth() - 14, y + 6 - 10, linePaint);

        //繪制X刻度坐標。
        float x = 0;
        if(dateX!=null){
            for (int n = 0; n < dateX.size(); n++) {
                //取X刻度坐標.
                x = gridX + (n) * xSpace;//在原點(0,0)處也畫刻度(不畫的話就是n+1),向右移動一個跨度。
                //畫X軸具體刻度值。
                if (dateX.get(n) != null) {
                    //canvas.drawLine(x, gridY - 30, x, gridY - 18, linePaint);//短X刻度。
                    canvas.drawText(dateX.get(n), x, gridY + 5, textPaint);//X具體刻度值。
                }
            }
        }

        float my = 0;

        if(dateY!=null){

            for(int n=0;n0){
            float lastPointX = 0; //前一個點
            float lastPointY = 0;
            float currentPointX = 0;//當前點
            float currentPointY = 0;
            for(int n=0;n da = data.get(n);
                List da_x = new ArrayList<>();
                List da_y = new ArrayList<>();
                /**
                 * 曲線路勁
                 */
                Path curvePath = new Path();
                /**
                 * 漸變色路徑
                 */
                Path jianBianPath = new Path();

                for(int m=0;m0){
//                        canvas.drawLine(lastPointX, lastPointY, currentPointX, currentPointY, chartLinePaint);
//                    }
//                    lastPointX = currentPointX;
//                    lastPointY = currentPointY;
                }
                List calculate_y = calculate(da_y);
                List calculate_x = calculate(da_x);
                curvePath.moveTo(calculate_x.get(0).eval(0), calculate_y.get(0).eval(0));
                jianBianPath.moveTo(gridX,gridY - 20 - 10);
                jianBianPath.lineTo(calculate_x.get(0).eval(0), calculate_y.get(0).eval(0));
                chartLinePaint.setColor(colors.get(n));
                float lastx = 0;
                for (int i = 0; i < calculate_x.size(); i++) {
                    for (int j = 1; j <= STEPS; j++) {
                        float u = j / (float) STEPS;
                        curvePath.lineTo(calculate_x.get(i).eval(u), calculate_y.get(i)
                                .eval(u));
                        jianBianPath.lineTo(calculate_x.get(i).eval(u), calculate_y.get(i)
                                .eval(u));
                        lastx = calculate_x.get(i).eval(u);
                    }
                }
                jianBianPath.lineTo(lastx,gridY - 20 - 10);
                canvas.drawPath(curvePath, chartLinePaint);
                Shader mShader = new LinearGradient(0,30 + 10,0,gridY - 20 - 10,new int[] {colors.get(n),Color.TRANSPARENT},null,Shader.TileMode.REPEAT);
//新建一個線性漸變,前兩個參數是漸變開始的點坐標,第三四個參數是漸變結束的點的坐標。連接這2個點就拉出一條漸變線了,玩過PS的都懂。然後那個數組是漸變的顏色。下一個參數是漸變顏色的分布,如果為空,每個顏色就是均勻分布的。最後是模式,這裡設置的是循環漸變

                chartJianbianPaint.setShader(mShader);
                canvas.drawPath(jianBianPath, chartJianbianPaint);
            }
        }


//    /**
//     * 畫點.
//     *
//     * @param canvas
//     */
//    private void drawPoints(Canvas canvas) {
//        for (int i = 0; i < points.size(); i++) {
//            Point p = points.get(i);
//            canvas.drawCircle(p.x, p.y, 5, paint);
//        }
//    }


    /**
     * 計算曲線.
     *
     * @param x
     * @return
     */
    private List calculate(List x) {
        int n = x.size() - 1;
        float[] gamma = new float[n + 1];
        float[] delta = new float[n + 1];
        float[] D = new float[n + 1];
        int i;
        /*
         * We solve the equation [2 1 ] [D[0]] [3(x[1] - x[0]) ] |1 4 1 | |D[1]|
         * |3(x[2] - x[0]) | | 1 4 1 | | . | = | . | | ..... | | . | | . | | 1 4
         * 1| | . | |3(x[n] - x[n-2])| [ 1 2] [D[n]] [3(x[n] - x[n-1])]
         *
         * by using row operations to convert the matrix to upper triangular and
         * then back sustitution. The D[i] are the derivatives at the knots.
         */

        gamma[0] = 1.0f / 2.0f;
        for (i = 1; i < n; i++) {
            gamma[i] = 1 / (4 - gamma[i - 1]);
        }
        gamma[n] = 1 / (2 - gamma[n - 1]);

        delta[0] = 3 * (x.get(1) - x.get(0)) * gamma[0];
        for (i = 1; i < n; i++) {
            delta[i] = (3 * (x.get(i + 1) - x.get(i - 1)) - delta[i - 1])
                    * gamma[i];
        }
        delta[n] = (3 * (x.get(n) - x.get(n - 1)) - delta[n - 1]) * gamma[n];

        D[n] = delta[n];
        for (i = n - 1; i >= 0; i--) {
            D[i] = delta[i] - gamma[i] * D[i + 1];
        }

        /* now compute the coefficients of the cubics */
        List cubics = new LinkedList();
        for (i = 0; i < n; i++) {
            Cubic c = new Cubic(x.get(i), D[i], 3 * (x.get(i + 1) - x.get(i))
                    - 2 * D[i] - D[i + 1], 2 * (x.get(i) - x.get(i + 1)) + D[i]
                    + D[i + 1]);
            cubics.add(c);
        }
        return cubics;
    }

    class Cubic{
        float a,b,c,d;         /* a + b*u + c*u^2 +d*u^3 */

        public Cubic(float a, float b, float c, float d){
            this.a = a;
            this.b = b;
            this.c = c;
            this.d = d;
        }


        /** evaluate cubic */
        public float eval(float u) {
            return (((d*u) + c)*u + b)*u + a;
        }
    }
}
 Android自定義控件系列五:自定義絢麗水波紋效果
今天我們來利用Android自定義控件實現一個比較有趣的效果:滑動水波紋。先來看看最終效果圖: 圖一 效果還是很
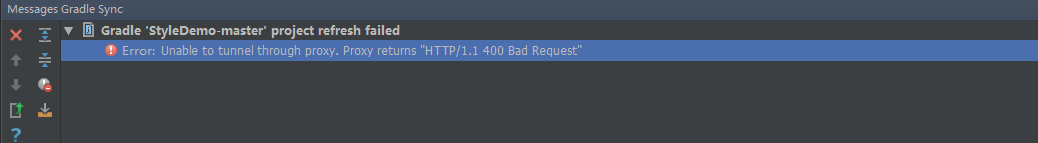 Android studio出現Error:Unable to tunnel through proxy. Proxy returns HTTP/1.1 400 Bad Reques的解決辦法
最近更新了一下Android Studio,在導入新項目之後出現Error:Unable to tunnel through proxy. Proxy returns &
 Android開發之微信底部菜單欄實現的幾種方法匯總
實現方式實現的方式有很多種 這裡總結最常見的幾種方式,以後再添加其他的。viewPager + RadioGroupviewPager + FragmentT
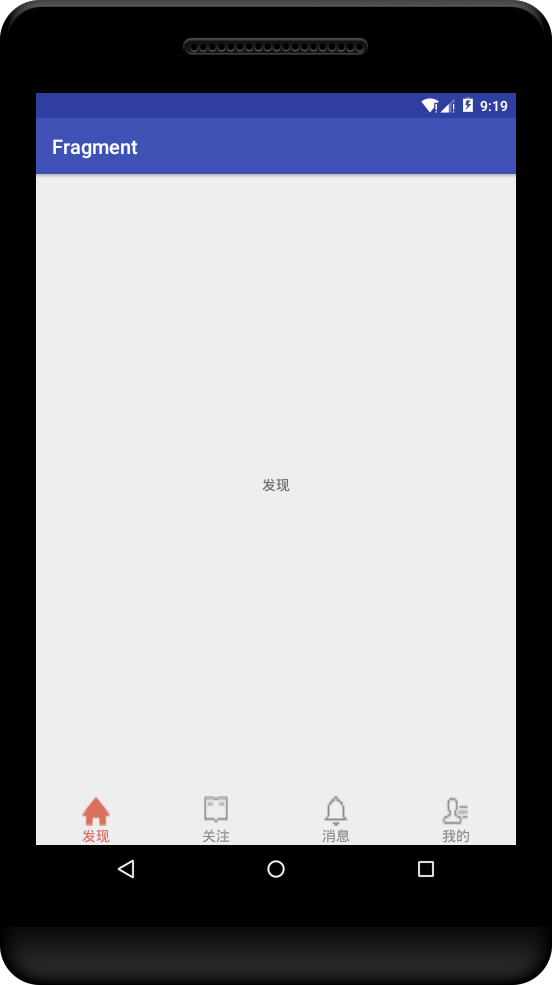
 Android實習札記(5)---Fragment之底部導航欄的實現
在Part 4我們回顧了一下Fragment的基本概念,在本節中我們就來學習Fragment應用的簡單例子吧! 就是使用Fragment來實現