編輯:關於Android編程
之前的文章已經介紹了怎麼繪制餅圖和曲線圖,今天這裡介紹另一種常用的統計圖——柱狀圖。
依舊是看一下效果圖:
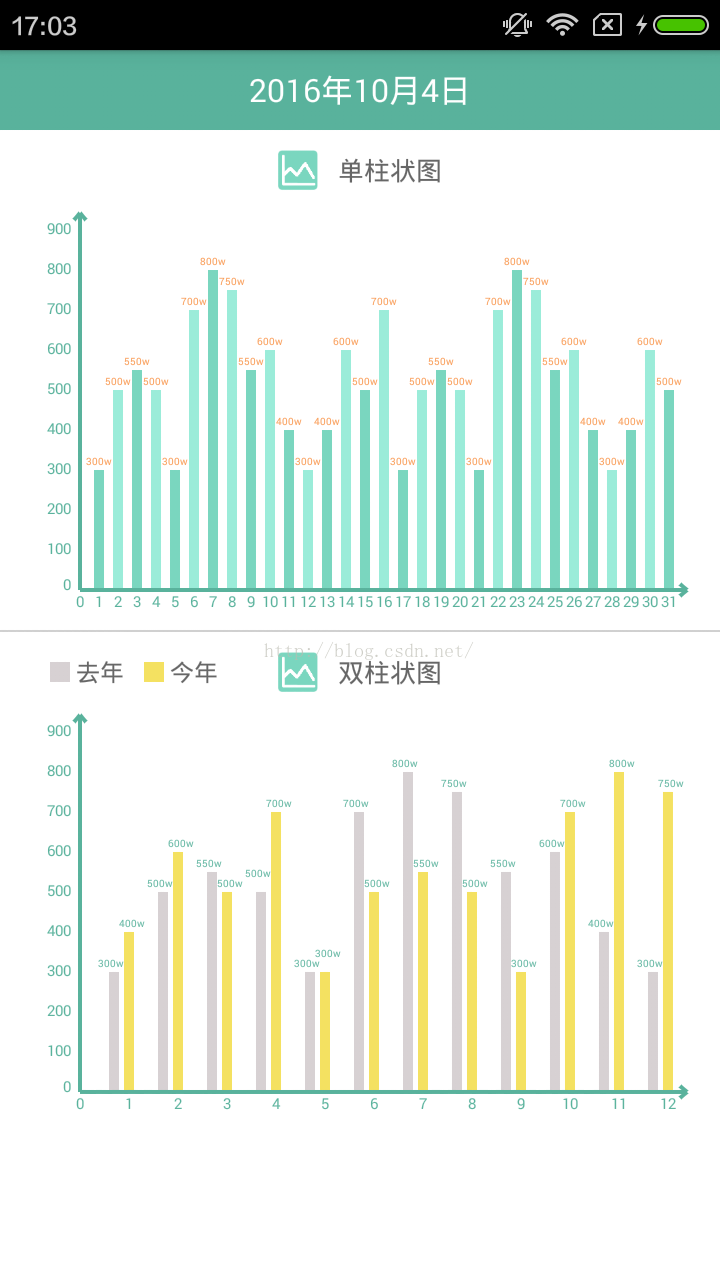
可以看到,圖中有兩幅柱狀圖,這裡簡單說明一下:第一幅是單柱狀圖,是根據同一組數據繪制的,每個柱子間距相同,相鄰柱子
用兩種顏色區分,視覺效果好一點;第二幅是雙柱狀圖,是根據兩組數據繪制的,同一刻度兩組數據之間間距相同,且用不同顏色
區分兩組數據,刻度與刻度之間的間距是根據數據數量變化調整的。
下面是主要實現方法:
public class CustomBarChart extends View {

    // 坐標單位
    private String[] xLabel;
    private String[] yLabel;
    // 曲線數據
    private List dataList;
    private List colorList;
    // 默認邊距
    private int margin = 20;
    // 距離左邊偏移量
    private int marginX = 30;
    // 原點坐標
    private int xPoint;
    private int yPoint;
    // X,Y軸的單位長度
    private int xScale;
    private int yScale;
    // 畫筆
    private Paint paintAxes;
    private Paint paintCoordinate;
    private Paint paintRectF;
    private Paint paintValue;

    public CustomBarChart(Context context, String[] xLabel, String[] yLabel,
                          List dataList, List colorList) {
        super(context);
        this.xLabel = xLabel;
        this.yLabel = yLabel;
        this.dataList = dataList;
        this.colorList = colorList;
    }

    public CustomBarChart(Context context) {
        super(context);
    }

    /**
     * 初始化數據值和畫筆
     */
    public void init() {
        xPoint = margin + marginX;
        yPoint = this.getHeight() - margin;
        xScale = (this.getWidth() - 2 * margin - marginX) / (xLabel.length - 1);
        yScale = (this.getHeight() - 2 * margin) / (yLabel.length - 1);

        paintAxes = new Paint();
        paintAxes.setStyle(Paint.Style.STROKE);
        paintAxes.setAntiAlias(true);
        paintAxes.setDither(true);
        paintAxes.setColor(ContextCompat.getColor(getContext(), R.color.color11));
        paintAxes.setStrokeWidth(4);

        paintCoordinate = new Paint();
        paintCoordinate.setStyle(Paint.Style.STROKE);
        paintCoordinate.setDither(true);
        paintCoordinate.setAntiAlias(true);
        paintCoordinate.setColor(ContextCompat.getColor(getContext(), R.color.color11));
        paintCoordinate.setTextSize(15);

        paintRectF = new Paint();
        paintRectF.setStyle(Paint.Style.FILL);
        paintRectF.setDither(true);
        paintRectF.setAntiAlias(true);
        paintRectF.setStrokeWidth(1);

        paintValue = new Paint();
        paintValue.setStyle(Paint.Style.STROKE);
        paintValue.setAntiAlias(true);
        paintValue.setDither(true);
        paintValue.setTextAlign(Paint.Align.CENTER);
        paintValue.setTextSize(10);
    }

    @Override
    protected void onDraw(Canvas canvas) {
        canvas.drawColor(ContextCompat.getColor(getContext(), R.color.color1));
        init();
        drawAxesLine(canvas, paintAxes);
        drawCoordinate(canvas, paintCoordinate);
        if (dataList.size() == 1) {
            drawBar(canvas, paintRectF, dataList.get(0), colorList);
            drawValue(canvas, paintValue, dataList.get(0), colorList.get(2));
        } else if (dataList.size() == 2) {
            drawBars(canvas, paintRectF, dataList, colorList);
            drawValues(canvas, paintValue, dataList, colorList.get(2));
        }
    }

    /**
     * 繪制坐標軸
     */
    private void drawAxesLine(Canvas canvas, Paint paint) {
        // X
        canvas.drawLine(xPoint, yPoint, this.getWidth() - margin / 6, yPoint, paint);
        canvas.drawLine(this.getWidth() - margin / 6, yPoint, this.getWidth() - margin / 2, yPoint - margin / 3, paint);
        canvas.drawLine(this.getWidth() - margin / 6, yPoint, this.getWidth() - margin / 2, yPoint + margin / 3, paint);

        // Y
        canvas.drawLine(xPoint, yPoint, xPoint, margin / 6, paint);
        canvas.drawLine(xPoint, margin / 6, xPoint - margin / 3, margin / 2, paint);
        canvas.drawLine(xPoint, margin / 6, xPoint + margin / 3, margin / 2, paint);
    }

    /**
     * 繪制刻度
     */
    private void drawCoordinate(Canvas canvas, Paint paint) {
        // X軸坐標
        for (int i = 0; i <= (xLabel.length - 1); i++) {
            paint.setTextAlign(Paint.Align.CENTER);
            int startX = xPoint + i * xScale;
            canvas.drawText(xLabel[i], startX, this.getHeight() - margin / 6, paint);
        }

        // Y軸坐標
        for (int i = 0; i <= (yLabel.length - 1); i++) {
            paint.setTextAlign(Paint.Align.LEFT);
            int startY = yPoint - i * yScale;
            int offsetX;
            switch (yLabel[i].length()) {
                case 1:
                    offsetX = 28;
                    break;

                case 2:
                    offsetX = 20;
                    break;

                case 3:
                    offsetX = 12;
                    break;

                case 4:
                    offsetX = 5;
                    break;

                default:
                    offsetX = 0;
                    break;
            }
            int offsetY;
            if (i == 0) {
                offsetY = 0;
            } else {
                offsetY = margin / 5;
            }
            canvas.drawText(yLabel[i], margin / 4 + offsetX, startY + offsetY, paint);
        }
    }

    /**
     * 繪制單柱形
     */
    private void drawBar(Canvas canvas, Paint paint, int data[], List colorList) {
        for (int i = 1; i <= (xLabel.length - 1); i++) {
            int startX = xPoint + i * xScale;
            RectF rect = new RectF(startX - 5, toY(data[i - 1]), startX + 5, this.getHeight() - margin - 2);
            if (i % 2 == 1) {
                paint.setColor(ContextCompat.getColor(getContext(), colorList.get(0)));
            } else {
                paint.setColor(ContextCompat.getColor(getContext(), colorList.get(1)));
            }
            canvas.drawRect(rect, paint);
        }
    }

    /**
     * 繪制雙柱形
     */
    private void drawBars(Canvas canvas, Paint paint, List dataList, List colorList) {
        for (int i = 1; i <= (xLabel.length - 1); i++) {
            int startX = xPoint + i * xScale;
            paint.setColor(ContextCompat.getColor(getContext(), colorList.get(0)));
            RectF rect1 = new RectF(startX - 20, toY(dataList.get(0)[i - 1]), startX - 10,
                    this.getHeight() - margin - 2);
            canvas.drawRect(rect1, paint);

            paint.setColor(ContextCompat.getColor(getContext(), colorList.get(1)));
            RectF rect2 = new RectF(startX - 5, toY(dataList.get(1)[i - 1]), startX + 5,
                    this.getHeight() - margin - 2);
            canvas.drawRect(rect2, paint);
        }
    }

    /**
     * 繪制單數值
     */
    private void drawValue(Canvas canvas, Paint paint, int data[], int color) {
        paint.setColor(ContextCompat.getColor(getContext(), color));
        for (int i = 1; i <= (xLabel.length - 1); i++) {
            canvas.drawText(data[i - 1] + "w", xPoint + i * xScale, toY(data[i - 1]) - 5, paintValue);
        }
    }

    /**
     * 繪制雙數值
     */
    private void drawValues(Canvas canvas, Paint paint, List dataList, int color) {
        paint.setColor(ContextCompat.getColor(getContext(), color));
        for (int i = 1; i <= (xLabel.length - 1); i++) {
            int startX = xPoint + i * xScale;
            int offsetY1 = 5;
            int offsetY2 = 5;
            if (dataList.get(0)[i - 1] == dataList.get(1)[i - 1]) {
                offsetY2 += 10;
            }
            if (i > 1) {
                if ((dataList.get(1)[i - 2] == dataList.get(0)[i - 1])) {
                    offsetY1 += 10;
                }
            }
            canvas.drawText(dataList.get(0)[i - 1] + "w", startX - 18,
                    toY(dataList.get(0)[i - 1]) - offsetY1, paintValue);
            canvas.drawText(dataList.get(1)[i - 1] + "w", startX + 3,
                    toY(dataList.get(1)[i - 1]) - offsetY2, paintValue);
        }
    }

    /**
     * 數據按比例轉坐標
     */
    private float toY(int num) {
        float y;
        try {
            float a = (float) num / 100.0f;
            y = yPoint - a * yScale;
        } catch (Exception e) {
            return 0;
        }
        return y;
    }

}
這裡對構造方法做一下簡單說明:
public CustomBarChart(Context context, String[] xLabel, String[] yLabel,
                          List dataList, List colorList)
第一個參數不用多說了;
第二個參數是一個字符串數組,是x軸的坐標刻度名稱,同時x軸也依據此數組長度劃分刻度軸,所以如果覺得x軸太密集了,這
裡可以間隔傳入空字符串代替原值,這樣坐標軸刻度會間隔繪制顯示;
第三個參數是一個字符串數組,是y軸的坐標刻度名稱,同時y軸也依據此數組長度劃分刻度軸。
第四個參數是一個整型數組的集合,集合最大長度只能為2,否則會出錯,博主這裡沒做容錯處理,所以尤其要注意。這個集合
代表了要繪制的柱狀圖的數值,傳入的集合包含一個整型數組代表繪制單柱狀圖,包含兩個整型數組代表繪制雙柱狀圖。還要強調
一下的是,這裡的兩個整型數組長度相同,且比x軸坐標刻度數組長度少1,因為坐標刻度從0開始計算。
第五個參數是一個整型值的集合,集合長度只能為3,否則會出錯,這裡也沒有做容錯處理所以請注意。這個集合代表了柱狀圖
裡面要用到的顏色的數值,具體定義在 res\values\colors.xml 文件中。這個集合裡面的三個整型數值代表的顏色分別為第一個柱子顏
色,第二個柱子顏色,要繪制的數值顏色。在單柱狀圖中,如果不希望柱圖顏色間隔繪制,可以傳入兩個相同的顏色數值作為集合
前兩個元素。這裡沒有對控制數值的是否顯示封裝一個方法另做處理,可以簡單的設置集合第三個參數為透明色,已達到不顯示數
值的效果。
最後來看一下具體調用:
    /**
     * 初始化柱狀圖1數據
     */
    private void initBarChart1() {
        String[] xLabel = {"0", "1", "2", "3", "4", "5", "6", "7", "8", "9", "10", "11", "12", "13",
                "14", "15", "16", "17", "18", "19", "20", "21", "22", "23", "24", "25", "26", "27",
                "28", "29", "30", "31"};
        String[] yLabel = {"0", "100", "200", "300", "400", "500", "600", "700", "800", "900"};
        int[] data1 = {300, 500, 550, 500, 300, 700, 800, 750, 550, 600, 400, 300, 400, 600, 500,
                700, 300, 500, 550, 500, 300, 700, 800, 750, 550, 600, 400, 300, 400, 600, 500};
        List data = new ArrayList<>();
        data.add(data1);
        List color = new ArrayList<>();
        color.add(R.color.color12);
        color.add(R.color.color13);
        color.add(R.color.color16);
        customBarChart1.addView(new CustomBarChart(this, xLabel, yLabel, data, color));
    }

    /**
     * 初始化柱狀圖2數據
     */
    private void initBarChart2() {
        String[] xLabel = {"0", "1", "2", "3", "4", "5", "6", "7", "8", "9", "10", "11", "12"};
        String[] yLabel = {"0", "100", "200", "300", "400", "500", "600", "700", "800", "900"};
        int[] data1 = {300, 500, 550, 500, 300, 700, 800, 750, 550, 600, 400, 300};
        int[] data2 = {400, 600, 500, 700, 300, 500, 550, 500, 300, 700, 800, 750};
        List data = new ArrayList<>();
        data.add(data1);
        data.add(data2);
        List color = new ArrayList<>();
        color.add(R.color.color14);
        color.add(R.color.color15);
        color.add(R.color.color11);
        customBarChart2.addView(new CustomBarChart(this, xLabel, yLabel, data, color));
    }
博主這裡寫的方法還比較粗糙,請不要介意,僅給需要的人提供一個思路,可以在此基礎上修改完善。
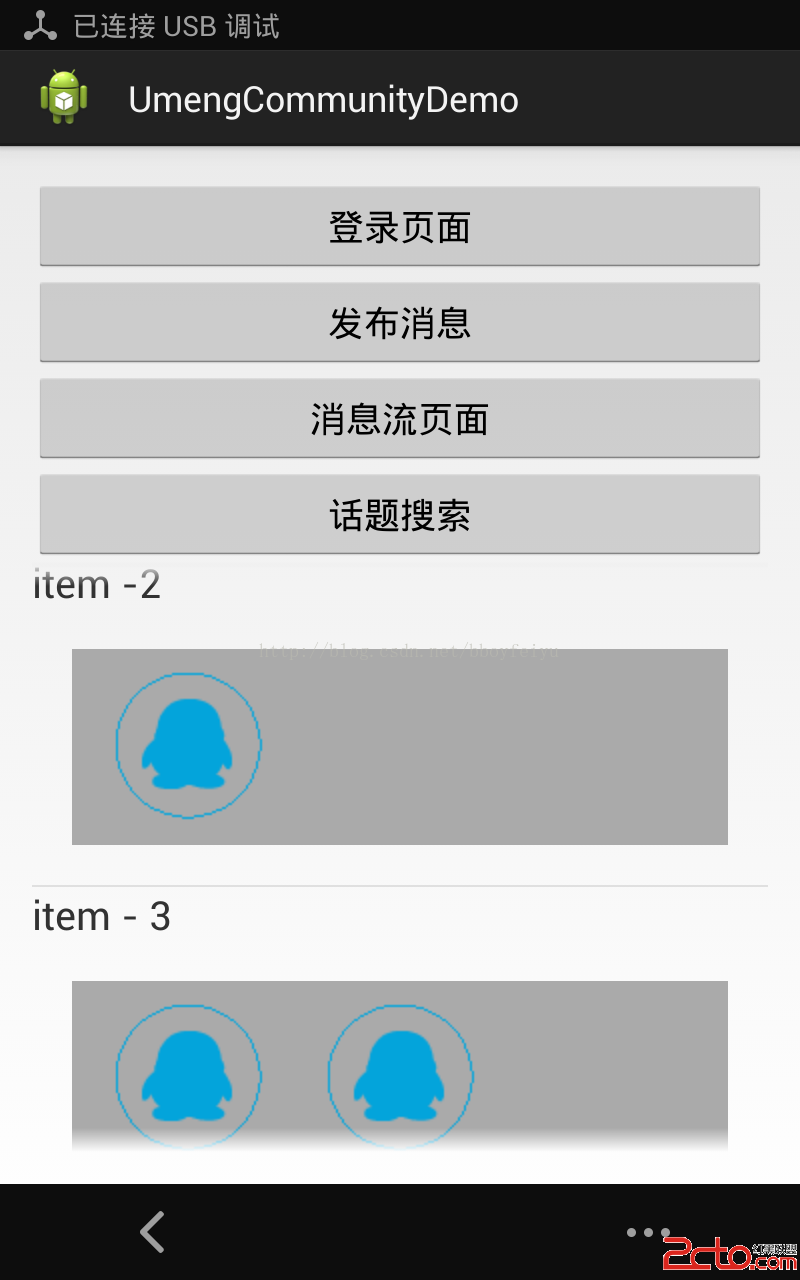 Android中ListView嵌套GridView的簡單消息流UI(解決寬高問題)
最近搞一個項目,需要用到類似於新浪微博的消息流,即每一項有文字、有九宮格圖片,因此這就涉及到ListView或者ScrollView嵌套GridView的問題。其中Gri
 Android(十四)解決AppBarLayout滑動不暢
最近在開發的App中需要實現Toolbar與頂部內容區域級聯滾動的效果,一開始就想到了Android 5.0 中新添加的AppBarLayout控件,其正好是實現這個效果
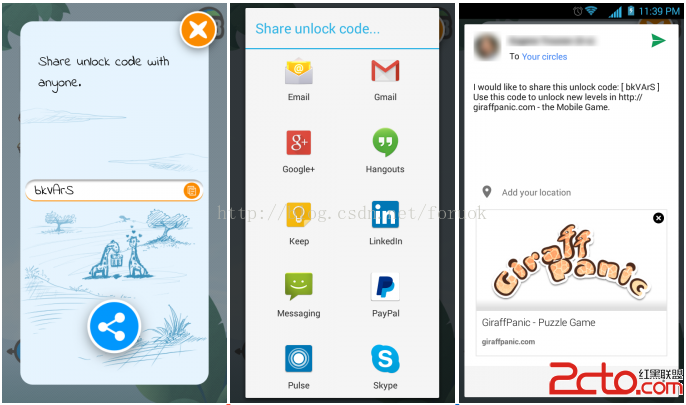 Qt on Android:添加分享功能
原文在這裡:Sharing with Qt on Android 。是 2014 年 12 月 12 日的文章,恨不相逢未嫁時……
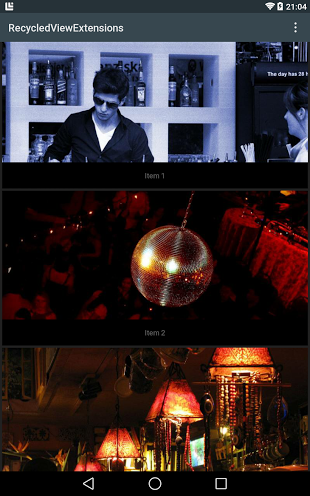 Android RecyclerView 基礎知識詳解
本周的谷歌I/O大會帶來了很多關於Android的振奮人心的消息。可能我們需要較長的時間來消化Android L引入的新東西。這些天我一直在研究RecyclerView,