編輯:關於Android編程
在 android開源圖表庫MPAndroidChart文檔翻譯(上)中,介紹了mpandroidchart的創建,回調方法,還有軸。這篇文章繼續翻譯剩余內容。文檔內容比較多,這是中篇。最後的內容在下篇做翻譯。
要給圖表設置數據,調用的方法為
public void setData(ChartData data) { ... }
 // this is just one of many constructors
    public LineData(ArrayList xVals, ArrayList sets) { ... }
例如,你可能想在LineChart中想展示兩家公司一年的季度收入。這種情況,建議使用兩個不同的LineDataSet對象,每個包含四個值(一年四個季度),使用ArrayList描述X軸上的標簽,只需要簡單數據源 "1.Q", "2.Q", "3.Q", "4.Q"。
當然,使用一個LineDataSet對象,包含這兩個公司的8個值也是可以的。
初始化LineDataSet對象
public LineDataSet(ArrayListyVals, String label) { ... }
Entry類型的ArrayList包含了表中的所有值,一個Entry對象包含了x軸的位置,和它對應的值。
public Entry(float val, int xIndex) { ... }
全部放在一起(超過一年的兩家公司的季度收入例子):
    ArrayList valsComp1 = new ArrayList();
    ArrayList valsComp2 = new ArrayList();
然後,填充這些Enty對象值。確保對應對象包含正確x軸索引。 (當然,在這裡可以使用一個循環,在這種情況下,循環的計數器變量可以是在x軸上的索引)。
   Entry c1e1 = new Entry(100.000f, 0); // 0 == quarter 1
    valsComp1.add(c1e1);
    Entry c1e2 = new Entry(50.000f, 1); // 1 == quarter 2 ...
    valsComp1.add(c1e2);
    // and so on ...

    Entry c2e1 = new Entry(120.000f, 0); // 0 == quarter 1
    valsComp2.add(c2e1);
    Entry c2e2 = new Entry(110.000f, 1); // 1 == quarter 2 ...
    valsComp2.add(c2e2);
    //...
這個時候,已經創建好了Entry對象的list,可以創建LineDataSet對象了
 LineDataSet setComp1 = new LineDataSet(valsComp1, "Company 1");
 setComp1.setAxisDependency(AxisDependency.LEFT);
 LineDataSet setComp2 = new LineDataSet(valsComp2, "Company 2");
 setComp2.setAxisDependency(AxisDependency.LEFT);
通過調用setAxisDependency,DataSet軸中應該對指定繪制,最後異步,但是重要,我們創建IDataSets 列表和x軸條目列表,並建立我們的ChartData對象:
  // use the interface ILineDataSet
    ArrayList dataSets = new ArrayList();
    dataSets.add(setComp1);
    dataSets.add(setComp2);

    ArrayList xVals = new ArrayList();
    xVals.add("1.Q"); xVals.add("2.Q"); xVals.add("3.Q"); xVals.add("4.Q");

    LineData data = new LineData(xVals, dataSets);
    mLineChart.setData(data);
    mLineChart.invalidate(); // refresh
調用invalidate之後,表會刷新,提供的數據會重繪
我們希望用紅色代表一個公司的數據
用綠色代表另一個公司數據。
代碼為
 LineDataSet setComp1 = new LineDataSet(valsComp1, "Company 1");
  // sets colors for the dataset, resolution of the resource name to a "real" color is done internally
  setComp1.setColors(new int[] { R.color.red1, R.color.red2, R.color.red3, R.color.red4 }, Context);

  LineDataSet setComp2 = new LineDataSet(valsComp2, "Company 2");
  setComp2.setColors(new int[] { R.color.green1, R.color.green2, R.color.green3, R.color.green4 }, Context);
setColors(int [] colors, Context c): 通過color資源id設置顏色
LineDataSet set = new LineDataSet(...);
set.setColors(ColorTemplate.VORDIPLOM_COLORS);
沒有設置顏色,使用默認值。
從1.6.2版本可用,在2.1.4版本做出修改。
ValueFormatter接口可以用來指定繪制的格式
ublic class MyValueFormatter implements ValueFormatter {

    private DecimalFormat mFormat;

    public MyValueFormatter() {
        mFormat = new DecimalFormat("###,###,##0.0"); // use one decimal
    }

    @Override
    public String getFormattedValue(float value, Entry entry, int dataSetIndex, ViewPortHandler viewPortHandler) {
        // write your logic here
        return mFormat.format(value) + " $"; // e.g. append a dollar-sign
    }
}
使用
// usage on whole data object
lineData.setValueFormatter(new MyValueFormatter());

// usage on individual dataset object
lineDataSet.setValueFormatter(new MyValueFormatter());
預定義的格式
LargeValueFormatter: 用於較大值得轉換,如1000轉換成1k,不支持小數點。
PercentFormatter:使用百分號,在餅狀圖中特別有用
StackedValueFormatter: 在 BarChart中使用. 它允許指定所有的堆棧值是否應繪制,或者是最高值
public class MyCustomXAxisValueFormatter implements XAxisValueFormatter {

    @Override
    public String getXValue(String original, int index, ViewPortHandler viewPortHandler) {
        // original is the original value to use, x-index is the index in your x-values array
        // implement your logic here ...
        return ...;
    }
}
// usage on XAxis, get axis instance:
XAxis xAxis = chart.getXAxis();

// set the formatter
xAxis.setValueFormatter(new MyCustomXAxisValueFormatter());
自定義格式轉換MyCustomXValueFormatter
public class MyYAxisValueFormatter implements YAxisValueFormatter {

    private DecimalFormat mFormat;

    public MyYAxisValueFormatter () {
        mFormat = new DecimalFormat("###,###,##0.0"); // use one decimal
    }

    @Override
    public String getFormattedValue(float value, YAxis yAxis) {
        // write your logic here
        // access the YAxis object to get more information
        return mFormat.format(value) + " $"; // e.g. append a dollar-sign
    }
}
設置
// get an instance of the YAxis (e.g. left axis)
YAxis leftAxis = chart.getAxisLeft();
leftAxis.setValueFormatter(new MyYAxisValueFormatter());
折線圖,條形表,散點圖,K線圖,氣泡圖
setAutoScaleMinMaxEnabled(boolean enabled): 指示是否啟用在y軸自動縮放。如果啟用,當視角變換時,Y軸自動調整到和當前的X軸范圍適應的最小值,默認值false
setKeepPositionOnRotation(boolean enabled): 伸縮之後是否能還原到原來的位置. 默認值false
Legend legend = chart.getLegend();
setEnabled(boolean enabled)
Legend l = chart.getLegend();
    l.setFormSize(10f); // set the size of the legend forms/shapes
    l.setForm(LegendForm.CIRCLE); // set what type of form/shape should be used
    l.setPosition(LegendPosition.BELOW_CHART_LEFT);
    l.setTypeface(...);
    l.setTextSize(12f);
    l.setTextColor(Color.BLACK);
    l.setXEntrySpace(5f); // set the space between the legend entries on the x-axis
    l.setYEntrySpace(5f); // set the space between the legend entries on the y-axis

    // set custom labels and colors
    l.setCustom(ColorTemplate.VORDIPLOM_COLORS, new String[] { "Set1", "Set2", "Set3", "Set4", "Set5" });

    // and many more...
 // EXAMPLE 1
 // add entries to the "data" object
 exampleData.addEntry(...);
 chart.notifyDataSetChanged(); // let the chart know it's data changed
 chart.invalidate(); // refresh

 // EXAMPLE 2
 // add entries to "dataSet" object
 dataSet.addEntry(...);
 exampleData.notifyDataChanged(); // let the data know a dataSet changed
 chart.notifyDataSetChanged(); // let the chart know it's data changed
 chart.invalidate(); // refresh
示例
DynamicalAddingActivity
RealtimeDataActivity
這個庫有多種修改視圖方法,需要注意的是,這些方法只適用於LineChart, BarChart, ScatterChart and CandleStickChart。
下面提到的方法是Chart類提供的方法,另一種方法是通過ViewPortHandler直接訪問,但是這種方法只推薦熟悉API的高級用戶使用。
限制可見性
setVisibleXRangeMaximum(float maxXRange): 設置X軸上可見區域的最大值。
setVisibleXRangeMinimum(float minXRange):設置X軸上可見的最小值,限制最小縮放。
setVisibleYRangeMaximum(float maxYRange, AxisDependency axis): 設置Y軸可見的最大值。
setViewPortOffsets(float left, float top, float right, float bottom): 設置視圖偏移量,影響自動偏移量,使用resetViewPortOffsets()方法撤銷操作
etExtraOffsets(float left, float top, float right, float bottom):設置額外的偏移量,這樣做不會改變自動偏移量
移動視圖
fitScreen(): 充滿邊界
moveViewToX(float xValue):移動到X軸固定位置
moveViewTo(float xValue, float yValue, AxisDependency axis): 移動到X,Y軸固定位置
移動動畫設置
moveViewToAnimated(float xValue, float yValue, AxisDependency axis, long duration)
centerViewToAnimated(float xValue, float yValue, AxisDependency axis, long duration)
注意:所有的moveViewTo方法都會自動刷新視圖,不需要調用invalidate()方法
縮放
zoomIn()
zoomOut():
zoom(float scaleX, float scaleY, float x, float y):
zoom(float scaleX, float scaleY, float xValue, float yValue, AxisDependency axis):
縮放動畫
zoomAndCenterAnimated(float scaleX, float scaleY, float xValue, float yValue, AxisDependency axis, long duration):
chart.setData(...); // first set data

// now modify viewport
chart.setVisibleXRangeMaximum(20); // allow 20 values to be displayed at once on the x-axis, not more
chart.moveViewToX(10); // set the left edge of the chart to x-index 10
// moveViewToX(...) also calls invalidate()
mChart.animateX(3000); // animate horizontal 3000 milliseconds
// or:
mChart.animateY(3000); // animate vertical 3000 milliseconds
// or:
mChart.animateXY(3000, 3000); // animate horizontal and vertical 3000 milliseconds
如果調用那個了animate(...) 方法, 不需要調用 invalidate() 就可以刷新圖表
public enum EasingOption {
      Linear,
      EaseInQuad,
      EaseOutQuad,
      EaseInOutQuad,
      EaseInCubic,
      EaseOutCubic,
      EaseInOutCubic,
      EaseInQuart,
      EaseOutQuart,
      EaseInOutQuart,
      EaseInSine,
      EaseOutSine,
      EaseInOutSine,
      EaseInExpo,
      EaseOutExpo,
      EaseInOutExpo,
      EaseInCirc,
      EaseOutCirc,
      EaseInOutCirc,
      EaseInElastic,
      EaseOutElastic,
      EaseInOutElastic,
      EaseInBack,
      EaseOutBack,
      EaseInOutBack,
      EaseInBounce,
      EaseOutBounce,
      EaseInOutBounce,
  }
使用方法
public void animateY(int durationmillis, EasingFunction function);自定義動畫設置實現接口
 /**
  * Interface for creating custom made easing functions.
  */
  public interface EasingFunction {
     /**
      * Called everytime the animation is updated.
      * @param input - the time passed since the animation started (value between 0 and 1)
      */
      public float getInterpolation(float input);
  }
public class CustomMarkerView extends MarkerView {

    private TextView tvContent;

    public CustomMarkerView (Context context, int layoutResource) {
        super(context, layoutResource);
        // this markerview only displays a textview
        tvContent = (TextView) findViewById(R.id.tvContent);
    }

    // callbacks everytime the MarkerView is redrawn, can be used to update the
    // content (user-interface)
    @Override
    public void refreshContent(Entry e, Highlight highlight) {
        tvContent.setText("" + e.getVal()); // set the entry-value as the display text
    }

    @Override
    public int getXOffset(float xpos) {
        // this will center the marker-view horizontally
        return -(getWidth() / 2);
    }

    @Override
    public int getYOffset(float ypos) {
        // this will cause the marker-view to be above the selected value
        return -getHeight();
    }
}
使用CustomMarkerView mv = new CustomMarkerView(Context, R.layout.custom_marker_view_layout); // set the marker to the chart chart.setMarkerView(mv);
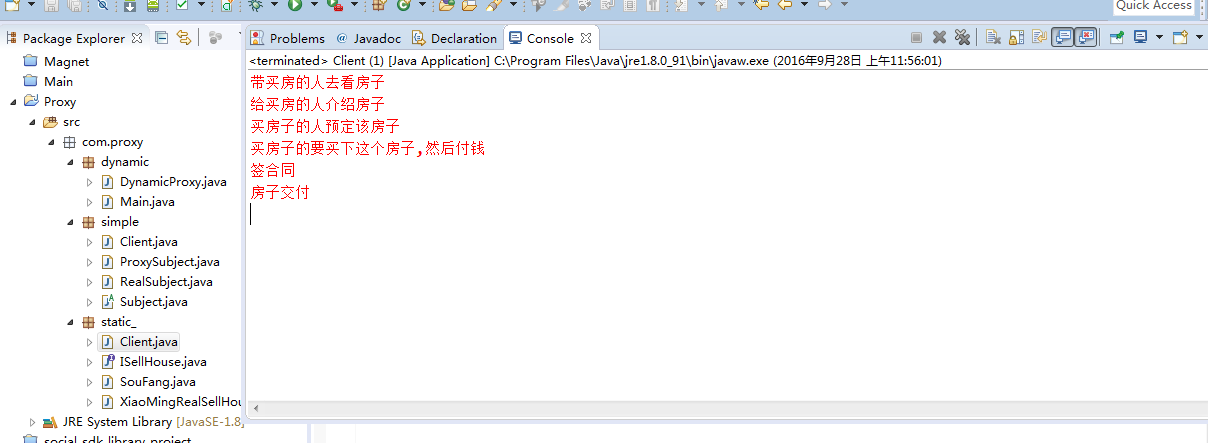 淺談 java /Android設計模式--代理模式(Proxy pattern)
1,代理模式介紹代理模式(Proxy Pattern)也稱為委托模式,其實代理模式在我們生活中非常常見,對於我們這些程序員來說最常接觸的莫過於代理上網了,連上代理服務器地
 Android檢查更新庫CheckUpdateLibrary使用教程
檢查更新並下載更新可以說是一個app必備的功能了.既然是必備功能,往往需要考慮很多東西,如下:1,更新方式:一個軟件有更新了,如果是上線了新的功能或修復了某些bug,或者
 Android開發----------- 手電筒改進版本
在之前的基礎上 在 res 文件夾下面: 添加一個 drawable/local_me.xml localme_cml 主程序: p
 Embedded Android 協同翻譯
如果你有一定的Android的基礎和英語基礎, 有願意貢獻開源社區的心, 如果你對以下目錄感興趣, 歡迎加入我們協同翻譯《Embedded Android》 此次協同翻